New Relic is a leading application performance monitoring (APM) platform that offers developers invaluable insights into the performance of their applications. APM tools provide us with real-time monitoring, diagnostics, and analytics capabilities that enable us to gain deep visibility into our applications, track down performance issues, and make informed decisions to improve the overall user experience. If you wish to add monitoring to your server, here is how you can use Grafana Loki to monitor your server logs. WordPress is the most popular CMS in the world. Integrating New Relic with WordPress can help developers optimize their code and identify bottlenecks. It also helps ensure that the WordPress applications perform well under different loads and usage scenarios.
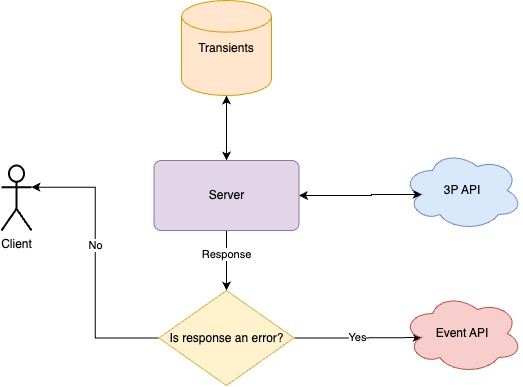
Recently, we shipped a WordPress solution that relies heavily on third-party API. To obfuscate the keys and other confidential data, we used WP REST API as a relay which acts like a proxy (sort of). On the client side, we hit the WP REST API endpoints, which call the third-party API. We use Transients to cache the response on the server side. We also use a caching layer on the client side (using Axios and LocalStorage). The transients (server-side cache) mitigate redundant requests from different users to the third-party API, whereas the client-side cache reduces redundant requests from the same user to the site’s backend.
In this post, we will learn how to integrate New Relic with WordPress using the Event API.
Overview
We could not install and configure New Relic’s PHP Agent to instrument external API calls (because the hosting platform did not allow that). Therefore, we decided to use the Event API. It is a powerful tool that allows us to send custom event data to New Relic Insights, their real-time analytics platform. Using Event API, we can capture and analyze specific events or metrics that are important to our application’s performance and operations.
Event API
Using the Event API, we can programmatically send structured JSON data to New Relic Insights. The data can then be visualized and queried to gain deeper insights into our application’s behavior. This can include information such as user interactions, system events, errors, custom metrics, or any other relevant data points.
To use Event API, we need to follow these steps:
- Obtain your New Relic
Ingest - LicenseAPI key. - Obtain your Account ID.
We have to use the following endpoint to POST to the Event API: https://insights-collector.newrelic.com/v1/accounts/{{ ACCOUNT_ID }}/events.
The API Key needs to be set in the Headers. The JSON payload looks like this:
{
  "eventType": "myEvent",
  "timestamp": 1652455543000,
  "applicationId": "myApp",
  "data": {
    "key1": "value1",
    "key2": "value2"
  }
}
The eventType is what we will use to query the data.
$access_id = EXTERNAL_API_KEY;
$response = wp_safe_remote_get( $endpoint );

if ( is_wp_error( $response ) || 200 !== $response['response']['code'] ) {
			$incident = send_external_api_incident( $endpoint, (string) $response['response']['code'], $response );
			return new WP_Error(
				(int) $response['response']['code'],
				array(
					'actual_response'    => $response,
					'new_relic_incident' => $incident,
				)
			);
		}
The send_external_api_incident() logic:
/**
 * Sends API Incident event to New Relic.
 *
 * @param  string          $endpoint
 * @param  string          $response_code
 * @param  array|\WP_Error $response
 * @return array|\WP_Error
 */
function send_external_api_incident( string $endpoint, string $response_code, array|\WP_Error $response ) {
	$base_url = 'https://insights-collector.newrelic.com/v1/accounts/' . NEW_RELIC_ACCOUNT_ID . '/events';
	$body     = [
		array(
			'eventType'    => 'ExternalApiIncident',
			'endpoint'     => $endpoint,
			'responseCode' => $response_code,
			'response'     => wp_json_encode( $response ),
		),
	];
	$response = wp_safe_remote_post(
		$base_url,
		array(
			'headers' => array(
				'Content-Type' => 'application/json',
				'Api-Key'      => NEW_RELIC_INGEST_KEY,
			),
			'body'    => wp_json_encode( $body ),
		)
	);

	return $response;
}
Checking the results
Head over to the your New Relic account and click on your application. You can use NRQL queries to query data.
SELECT * FROM `ExternalApiIncident` since 1 day ago
In conclusion, integrating New Relic with WordPress application offers a robust solution for monitoring and optimizing application performance. This approach not only enhances the visibility of your application’s internal workings but also ensures a seamless user experience by efficiently tracking and analyzing critical data points. By following the outlined steps and best practices, you can successfully implement this powerful tool, even in environments with certain restrictions. The ability to customize event tracking and gain insights through real-time analytics is invaluable for developers aiming to maintain high-performance standards. Remember, continuous monitoring and improvement are key to staying ahead in the fast-paced digital world. Utilize these insights to keep your application running smoothly, and always be proactive in seeking ways to refine and enhance your system’s performance.
Leave a Reply