If you love working with servers, you must have wanted a beautiful and efficient way to monitor your server logs. Grafana Loki does just that! Loki is a log aggregation system that is horizontally-scalable and highly-available. Inspired by Prometheus, Loki integrates pretty well with Grafana and is an amazing tool to monitor your server logs. It is fast since it does not index the content of the logs, but rather labels each set of log stream. In this tutorial, we will discuss how to set up Grafana Loki and integrate it with Grafana Dashboard. We will also learn how to add Nginx logs to the explorer.
The ‘Grafana’ Plan
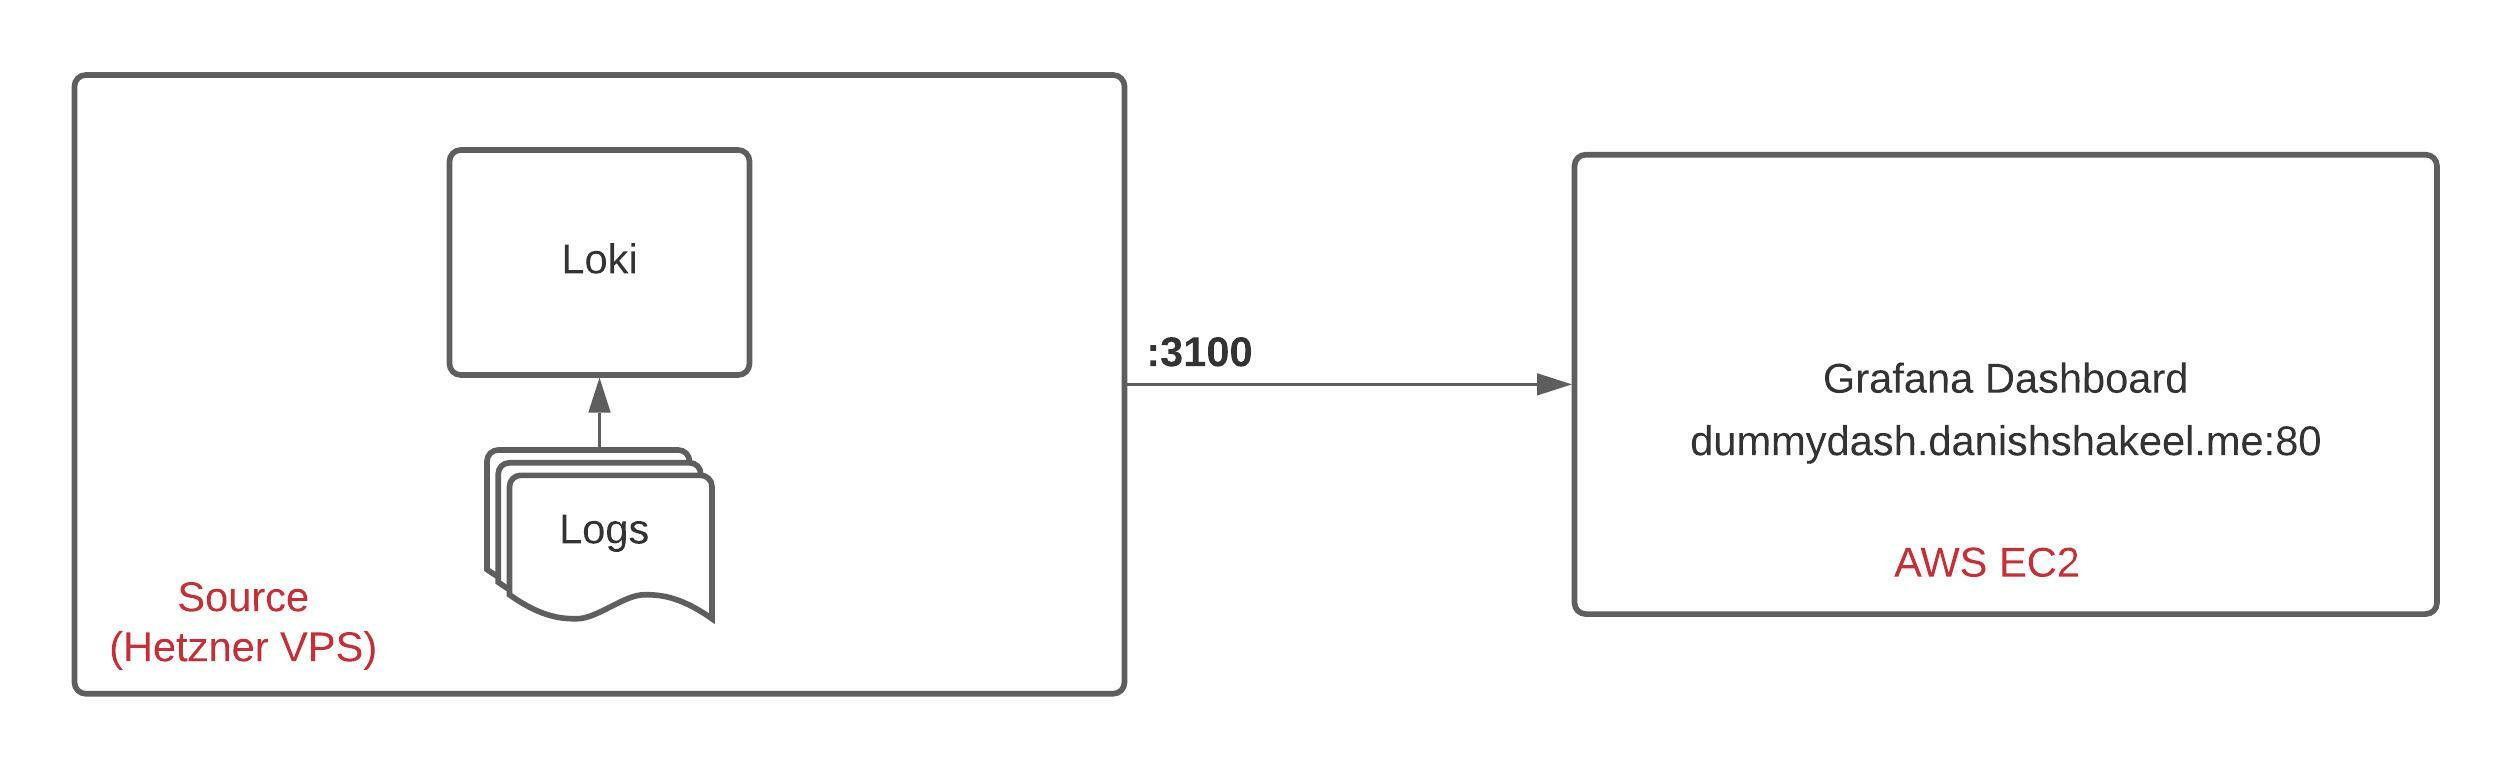
I want to monitor my personal server’s (let us call it the ‘source’) logs. My personal server is a Hetzner VPS and runs on Ubuntu Server 20.04 LTS. I plan to use an Amazon EC2 free-tier t2.micro instance to serve the Grafana Dashboard over HTTP. The source will run Grafana Loki inside a Docker container over port 3100. The dashboard will also have an Ubuntu Server 20.04 LTS.
Setting up the Grafana Dashboard
To serve our Grafana Dashboard, we will use an Amazon EC2 free-tier t2.micro instance running Ubuntu Server 20.04 LTS. Now, choosing the cloud service provider is completely upto you. You can also set up the dashboard locally or on a Raspberry Pi, if you have one. If you do not know how you can expose your Raspberry Pi to the public without a public IP, here is a guide for you. We do not need to do anything special, but make sure you allow access to port 80 (HTTP). Once it is done, connect to your instance via SSH.
Installing Grafana
Now, we need to install Grafana. We will install the Grafana Enterprise edition, but if you wish to go for the OSS release, you can follow this guide.
sudo apt-get install -y apt-transport-https
sudo apt-get install -y software-properties-common wget
wget -q -O - https://packages.grafana.com/gpg.key | sudo apt-key add -
To install the stable release, we need to add the repository using the following command:
echo "deb https://packages.grafana.com/enterprise/deb stable main" | sudo tee -a /etc/apt/sources.list.d/grafana.listIf everything goes well, we should be ready to install the grafana-enterprise package.
sudo apt-get update
sudo apt-get install grafana-enterprise
Starting Grafana
Now that Grafana is successfully installed, we need to start the service. To check if the Grafana service is loaded, we need to use the following command:
systemctl status grafana-server.serviceWe should see that the service is loaded. Let’s enable the service now.
systemctl enable grafana-server.serviceFinally, let’s start the service.
systemctl start grafana-server.serviceLet’s check if everything works well. In my case, I will navigate to 34.201.129.128:3000.
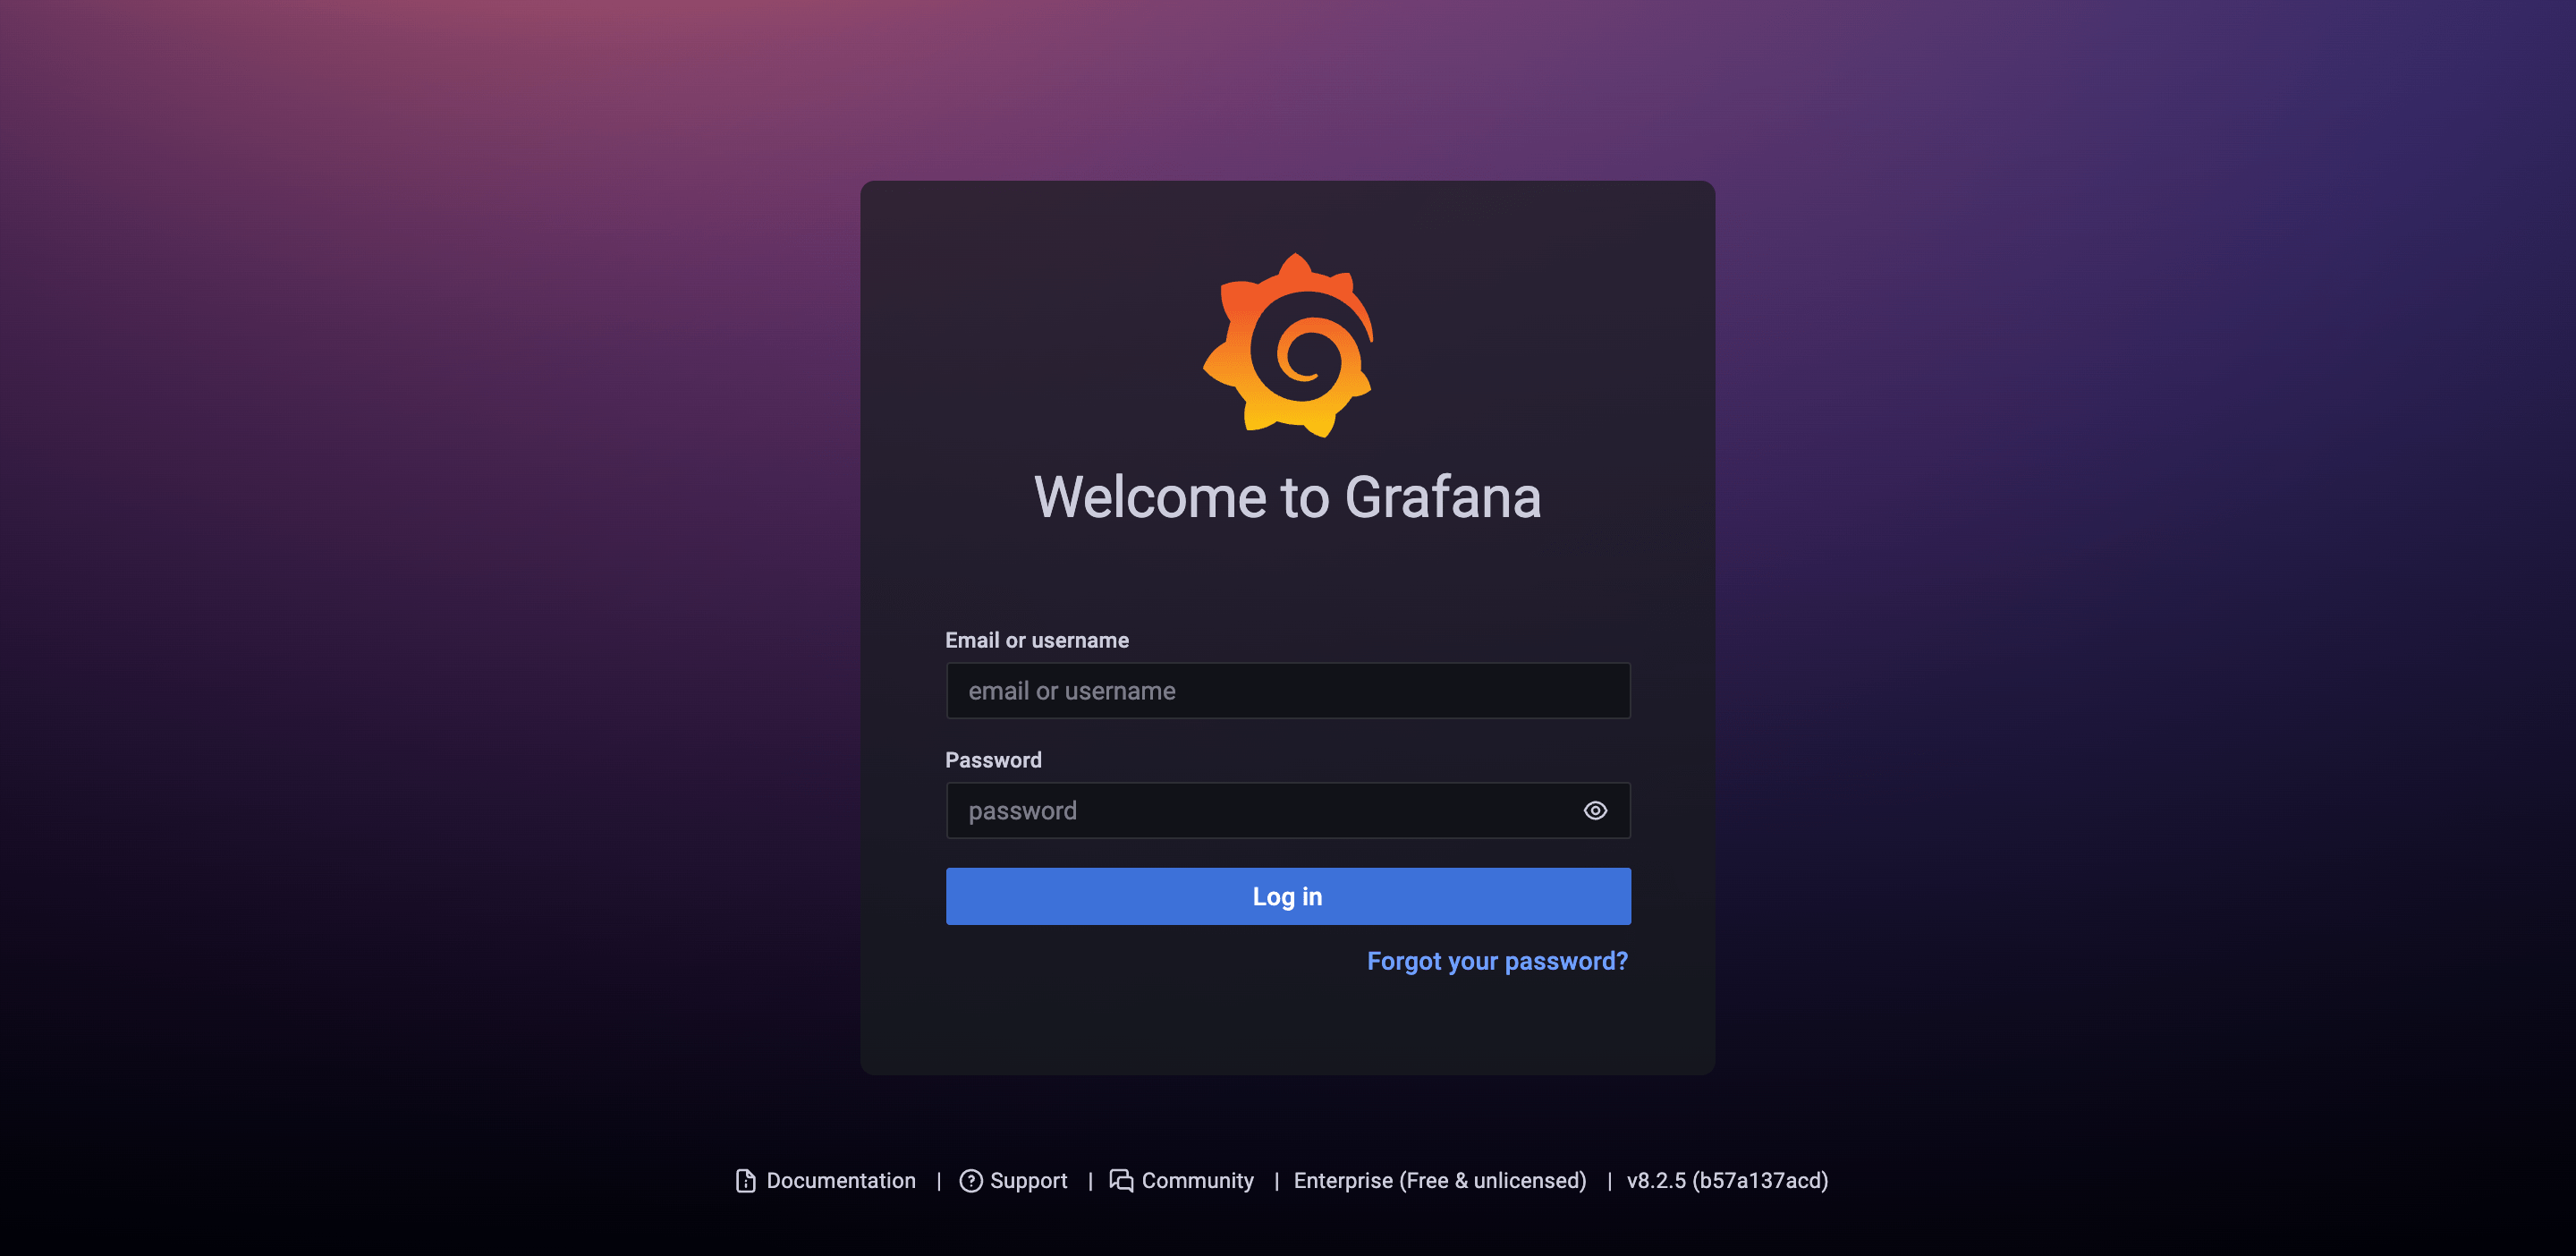
The default username is admin and password is admin.
Redirecting Port 80 to Grafana Port
We want to access Grafana Dashboard over HTTP but to bind Grafana to ports below 1024, we need to run grafana as root. Upon installation, Grafana creates a grafana user and the service runs under that user. We will redirect port 80 to 3000 using iptables to be able to access Grafana over HTTP.
iptables -t nat -A PREROUTING -p tcp --dport 80 -j REDIRECT --to-port 3000Now, I will create an A record pointing to the IP so that I can access Grafana over http://dummydash.danishshakeel.me.
Next step is to add a data source (Loki) to Grafana.
Setting up Grafana Loki
In order for Grafana to be able to fetch our server logs, we need to install Grafana Loki on our source. We will use Docker for this so make sure Docker is installed and working. First, let us pull the repository.
git clone https://github.com/grafana/loki.gitNow, let us cd into loki/production/ directory and pull the required images.
docker-compose pullThis will pull three images – loki, promtail, and grafana. We are ready to spin our containers.
docker-compose upThis will make Loki available via port 3100.
Adding Loki as a Data Source
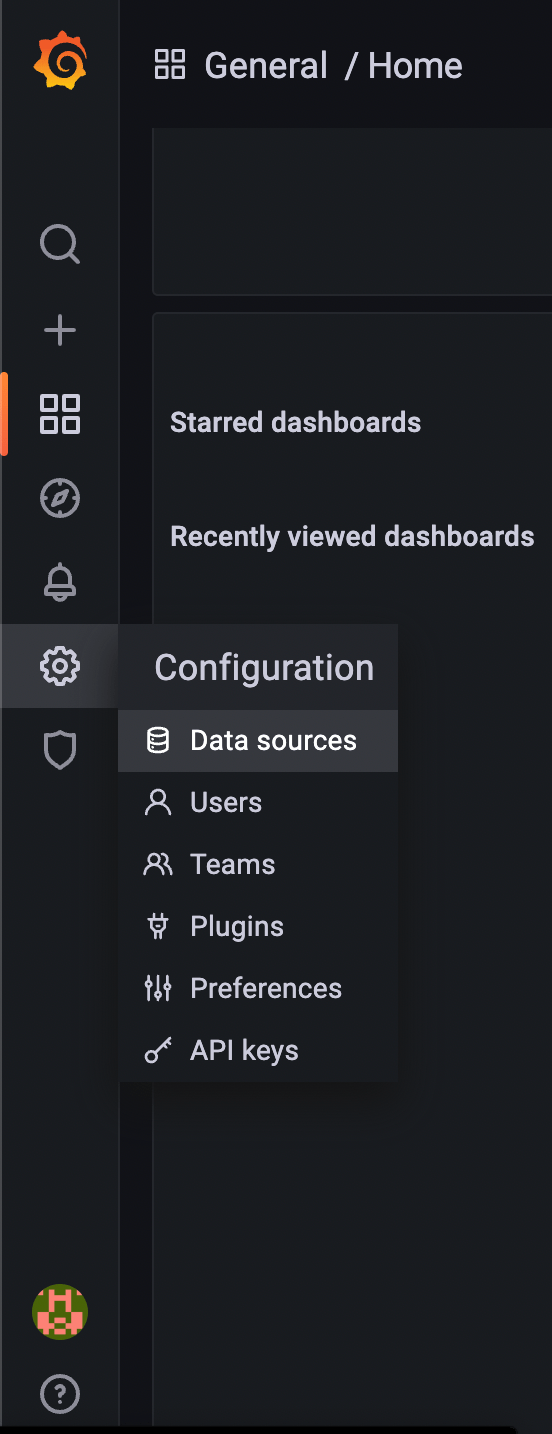
We are ready with Grafana Dashboard and Loki. Now, we need to integrate them. Head to your Grafana Dashboard > Gear Icon ⚙ > Data Source
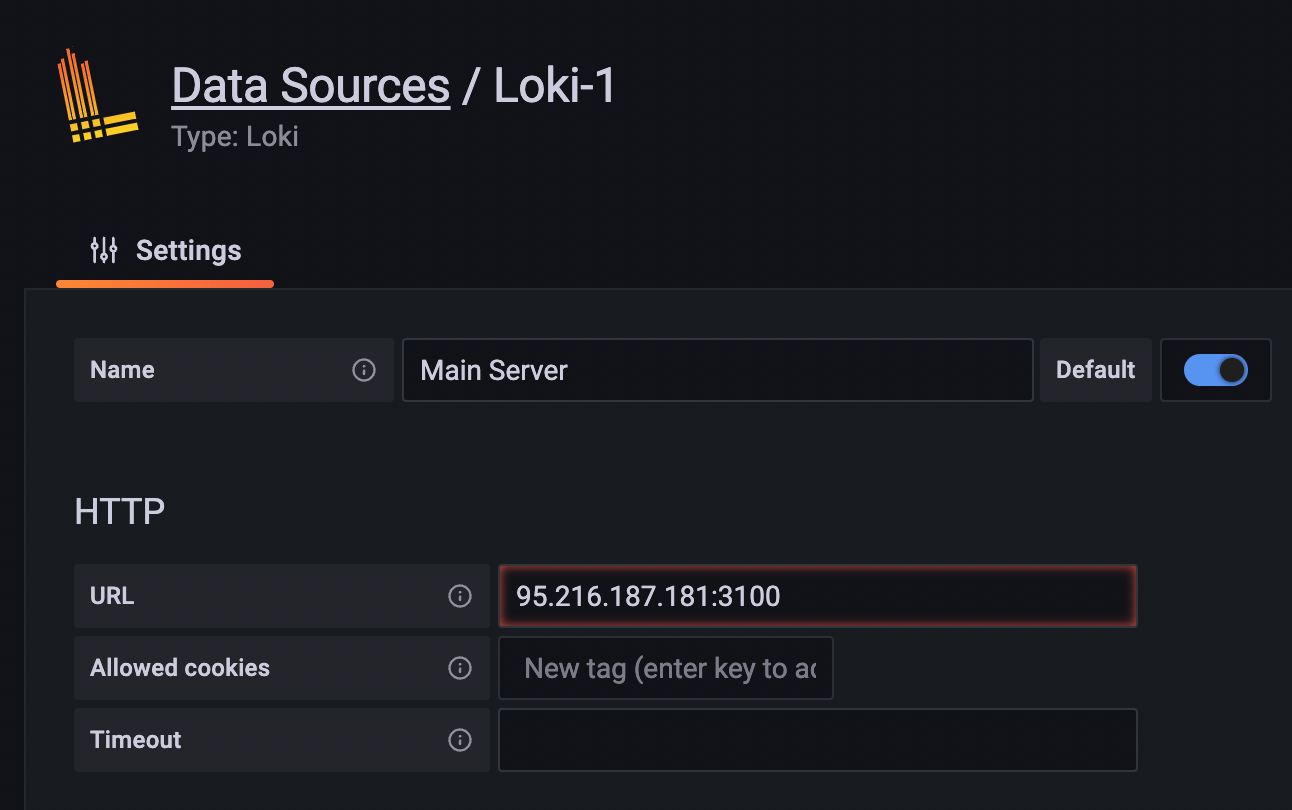
Click on ‘Add Data Source’ and choose Loki under Logging and Document Databases. Now, we will configure the Data Source.
We are all set! We should now be able to explore our logs from the dashboard.
Exploring Logs
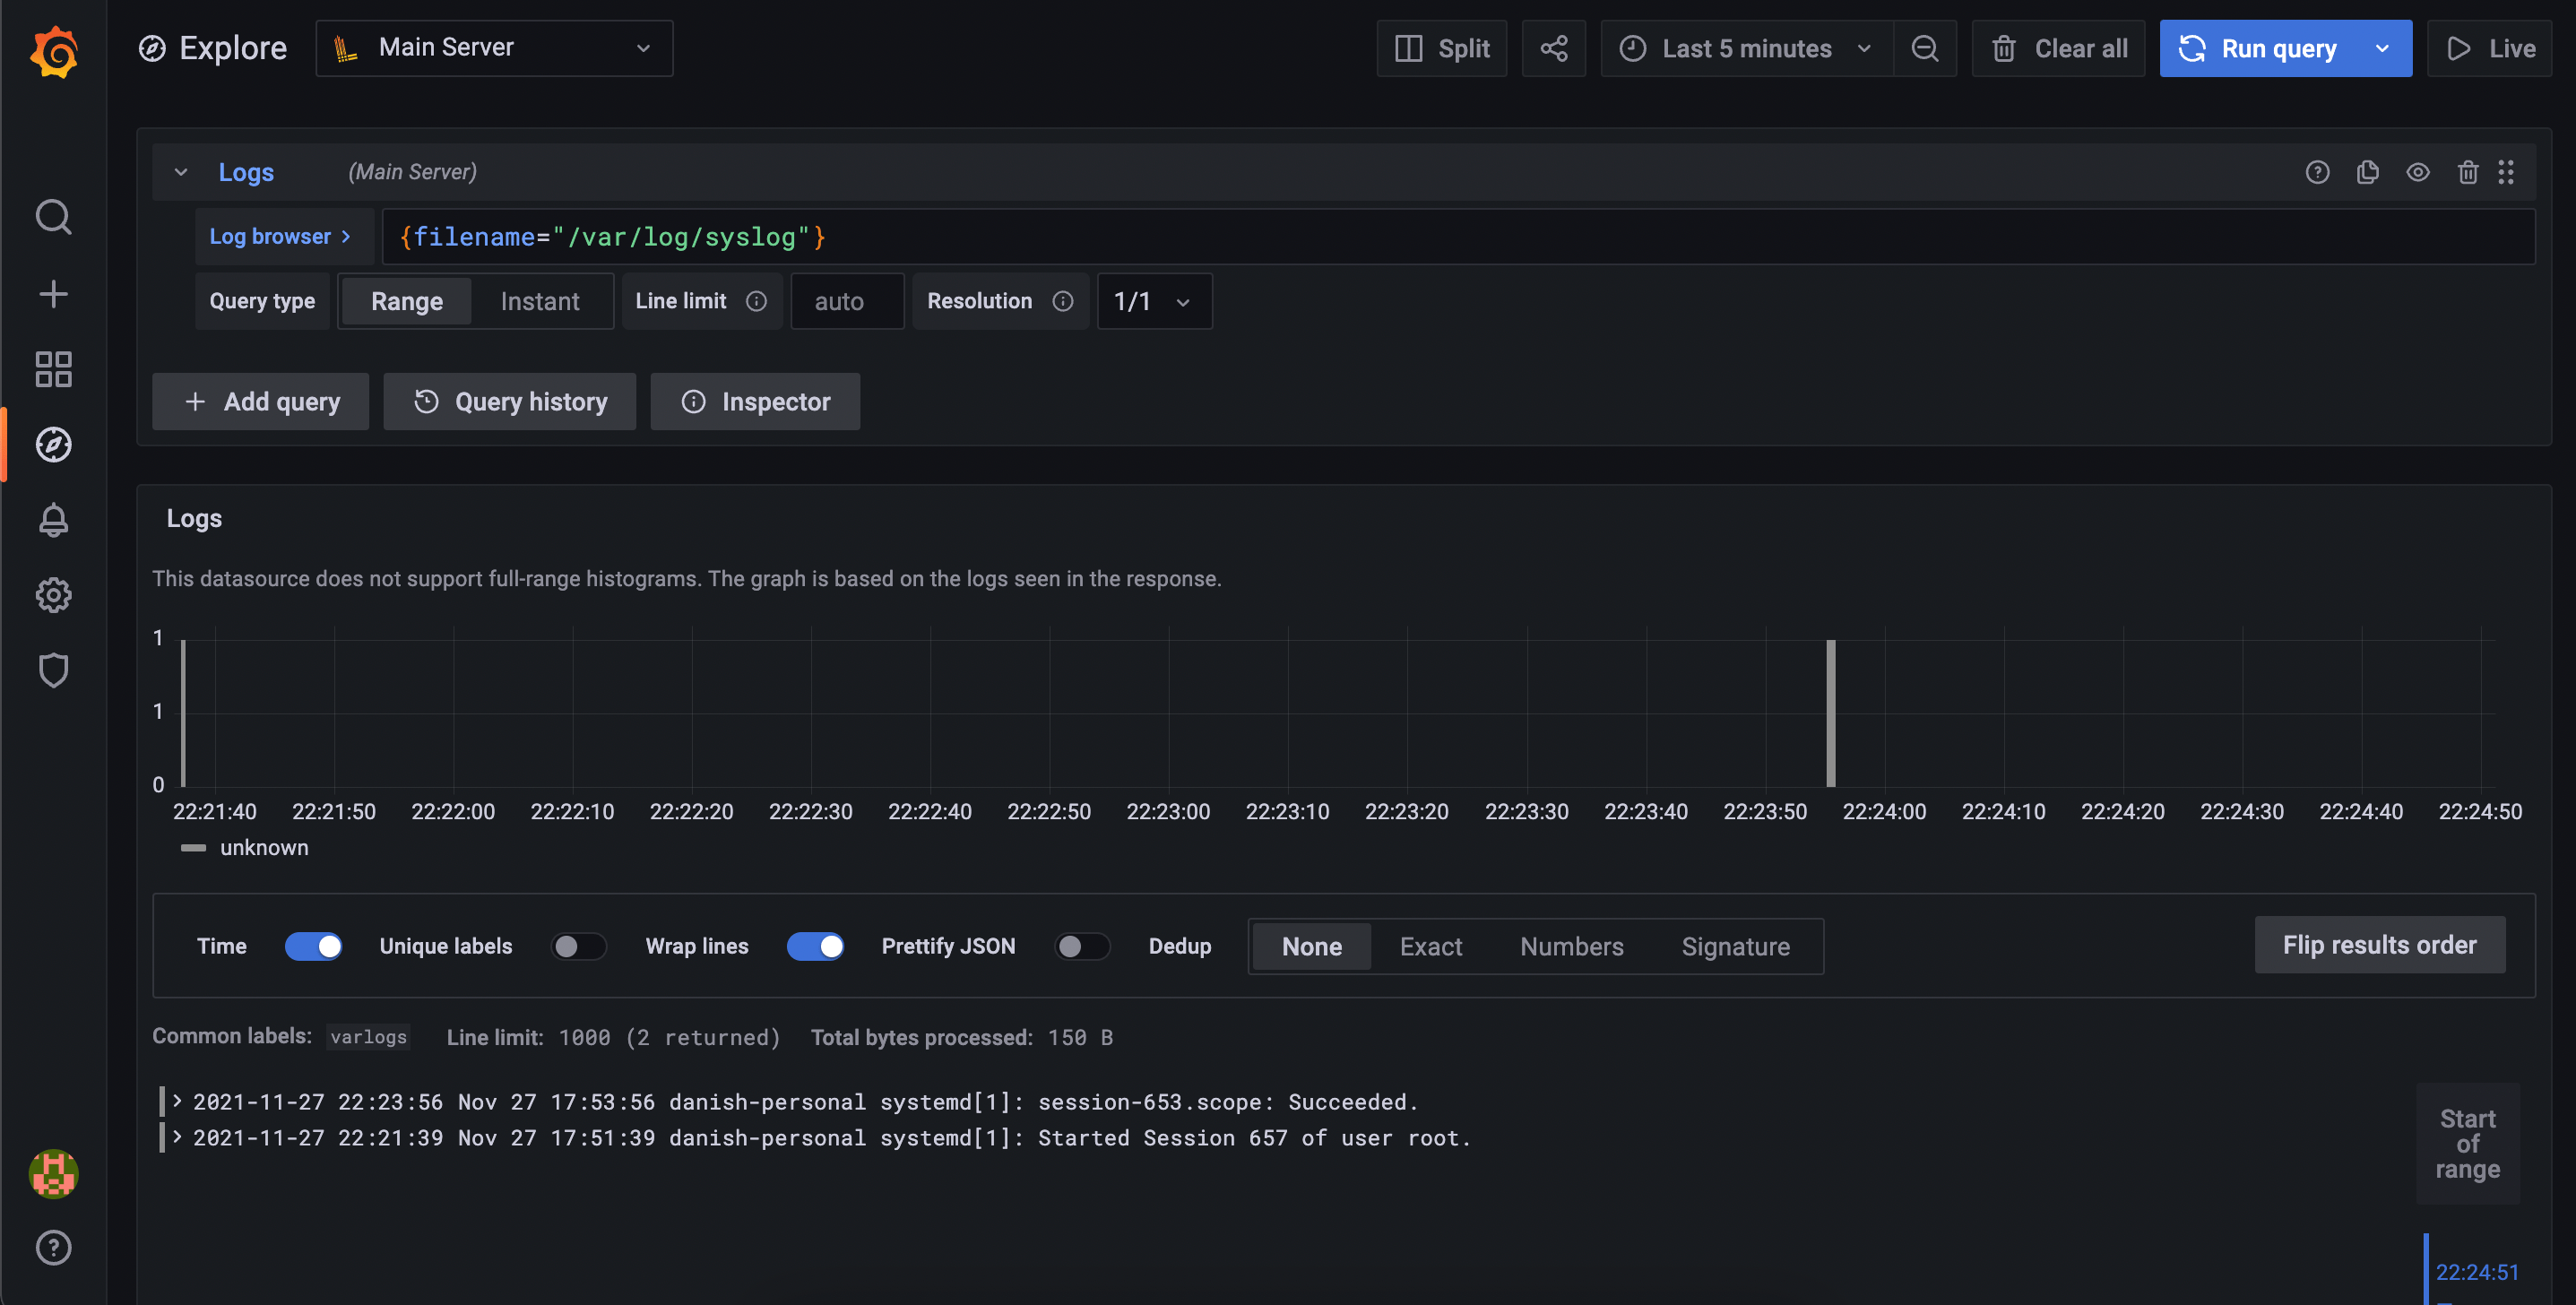
To explore the logs, click on the Explore option (?) in the sidebar. Click on the Data Source and you should be able to see the list of log files, select one to see the logs. You can also type in your query, for example: {filename="/var/log/syslog"} will yield the logs from syslog.
Exploring Nginx Logs
Loki will not store Nginx logs out of the box. We need to configure our deplyoment to do that. The default configuration for promtail is located at /etc/promtail/config.yml. To check it, we need to first initiate a shell session in our promtail container. We can get a list of running containers by docker ps. Copy promtail container’s id and run:
docker exec -it <container_id> bashWe will create our own configuration to access Nginx logs. Cd into /opt/loki/ on your host machine and create a new file – promtail-config.yml.
Add the following configuration to the file:
server:
  http_listen_port: 9080
  grpc_listen_port: 0

positions:
  filename: /tmp/positions.yaml

clients:
  - url: http://loki:3100/loki/api/v1/push

scrape_configs:
  - job_name: system
    static_configs:
    - targets:
        - localhost
      labels:
        job: varlogs
        __path__: /var/log/*log
  - job_name: nginx
    static_configs:
    - targets:
        - localhost
      labels:
        job: nginx
        __path__: /var/log/nginx/*log
We are simply adding another job and specifying the path to our nginx logs.
Once our configuration file has been added, we need to edit our compose file and map the configuration file from our host to the promtail container.
...
...
promtail:
image: grafana/promtail:master
volumes:
- /opt/loki/promtail-config.yml:/etc/promtail/new-config.yaml
- /var/log:/var/log
command: -config.file=/etc/promtail/new-config.yaml
networks:
- loki
...
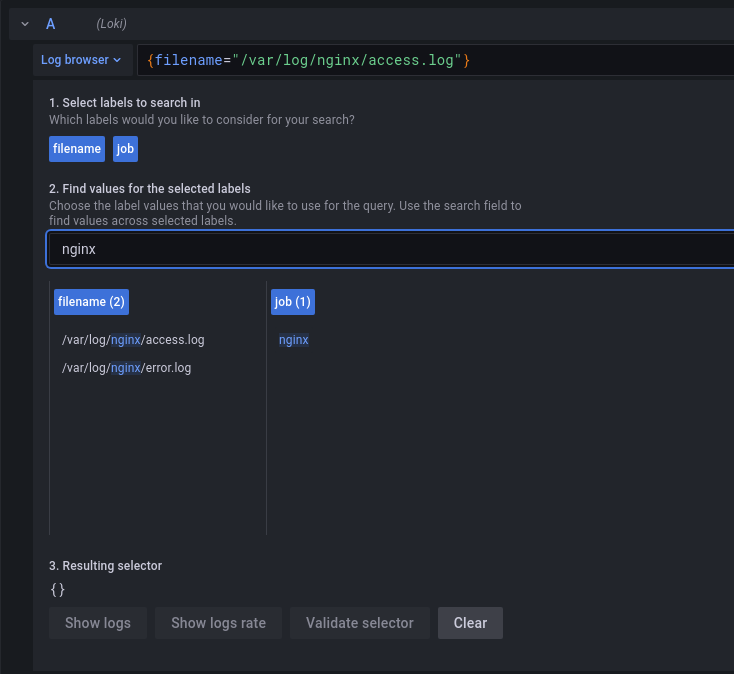
...You should now be able to see access.log and error.log in your Grafana Explorer.
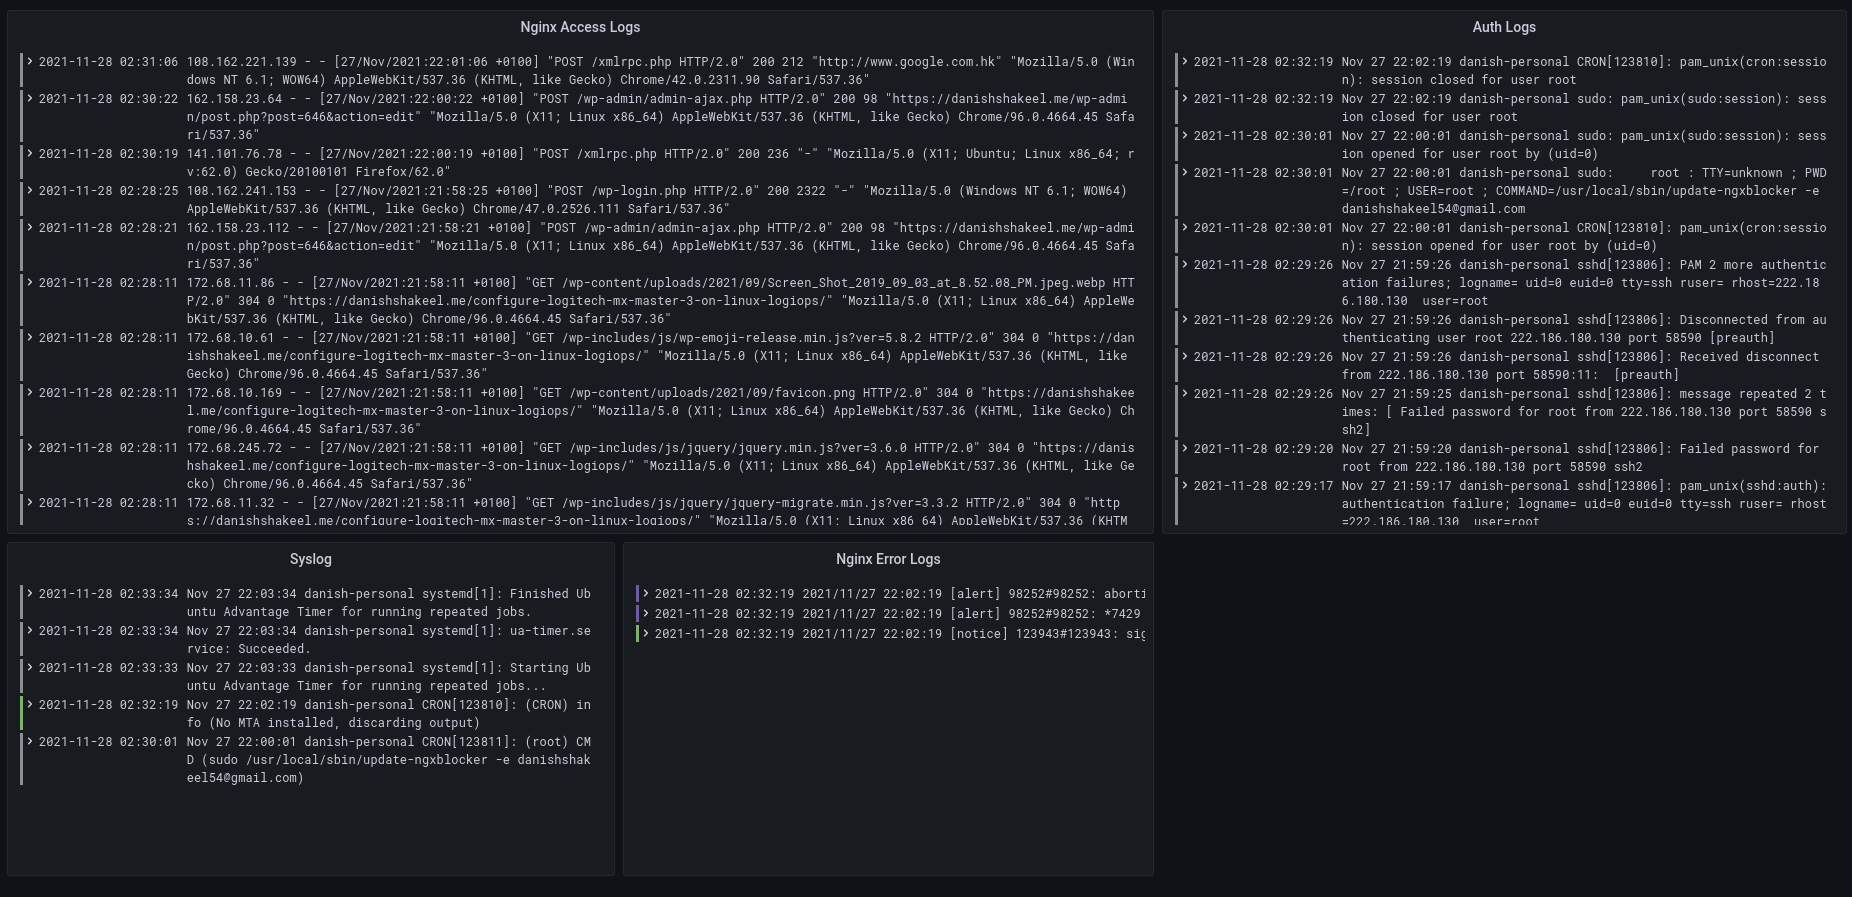
There you have it! We have successfully configured Grafana and Grafana Loki to monitor our server logs. We have also learnt to configure Nginx with Promtail to serve logs to Grafana.
What’s next?
Certainly, we want to create a centralized dashboard for all our logs as well as system metrics like Disk and CPU usage. In future, I will discuss how we can add Prometheus to Grafana and monitor our system metrics.
Leave a Reply